FinSIR: Financial SIR-GCN for Market-Aware Stock Recommendation
In our previous work on Contextualized Messages Boost Graph Representations, we introduced the soft-isomorphic relational graph convolution network (SIR-GCN), which featured an anisotropic (i.e., a function of both the features of the center and neighboring nodes) and dynamic (i.e., a universal function approximator) message function for graph neural networks (GNNs). For more information, refer to the accompanying blog post.
- Limitations of Existing Models
- Financial SIR-GCN (FinSIR)
- Backtesting Results on NYSE and NASDAQ
- Conclusion
In collaboration with experts from the Chinese University of Hong Kong, we developed a model based on SIR-GCN designed for market-aware stock recommendation. This work was presented at the 2025 International Joint Conference on Neural Networks (IJCNN) in Rome, Italy.
Limitations of Existing Models
Stock recommendation models in literature largely treat stocks in isolation and leverage models such as CNNs, RNNs, and Transformers to learn meaningful representations independently. This approach, however, ignores the rich stock relations (e.g., stocks belonging to the same industry) in a market.
Graph-based models address this issue by treating stock markets as spatio-temporal graphs, where nodes represent stocks and edges represent different types of stock relations. Typically, these models employ a temporal module (e.g., LSTMs) followed by a spatial module (e.g., GNNs) before the final prediction module. Notably, this decoupled nature in processing the spatial and temporal dimensions of stock market graphs potentially limits their performance.
Financial SIR-GCN (FinSIR)
Suppose is the spatio-temporal stock market graph at time . Furthermore, suppose represents the features of stock , represents the features of the edge connecting stock and , represents the true closing price of stock , and represents the true one-day (percentage) return of stock .
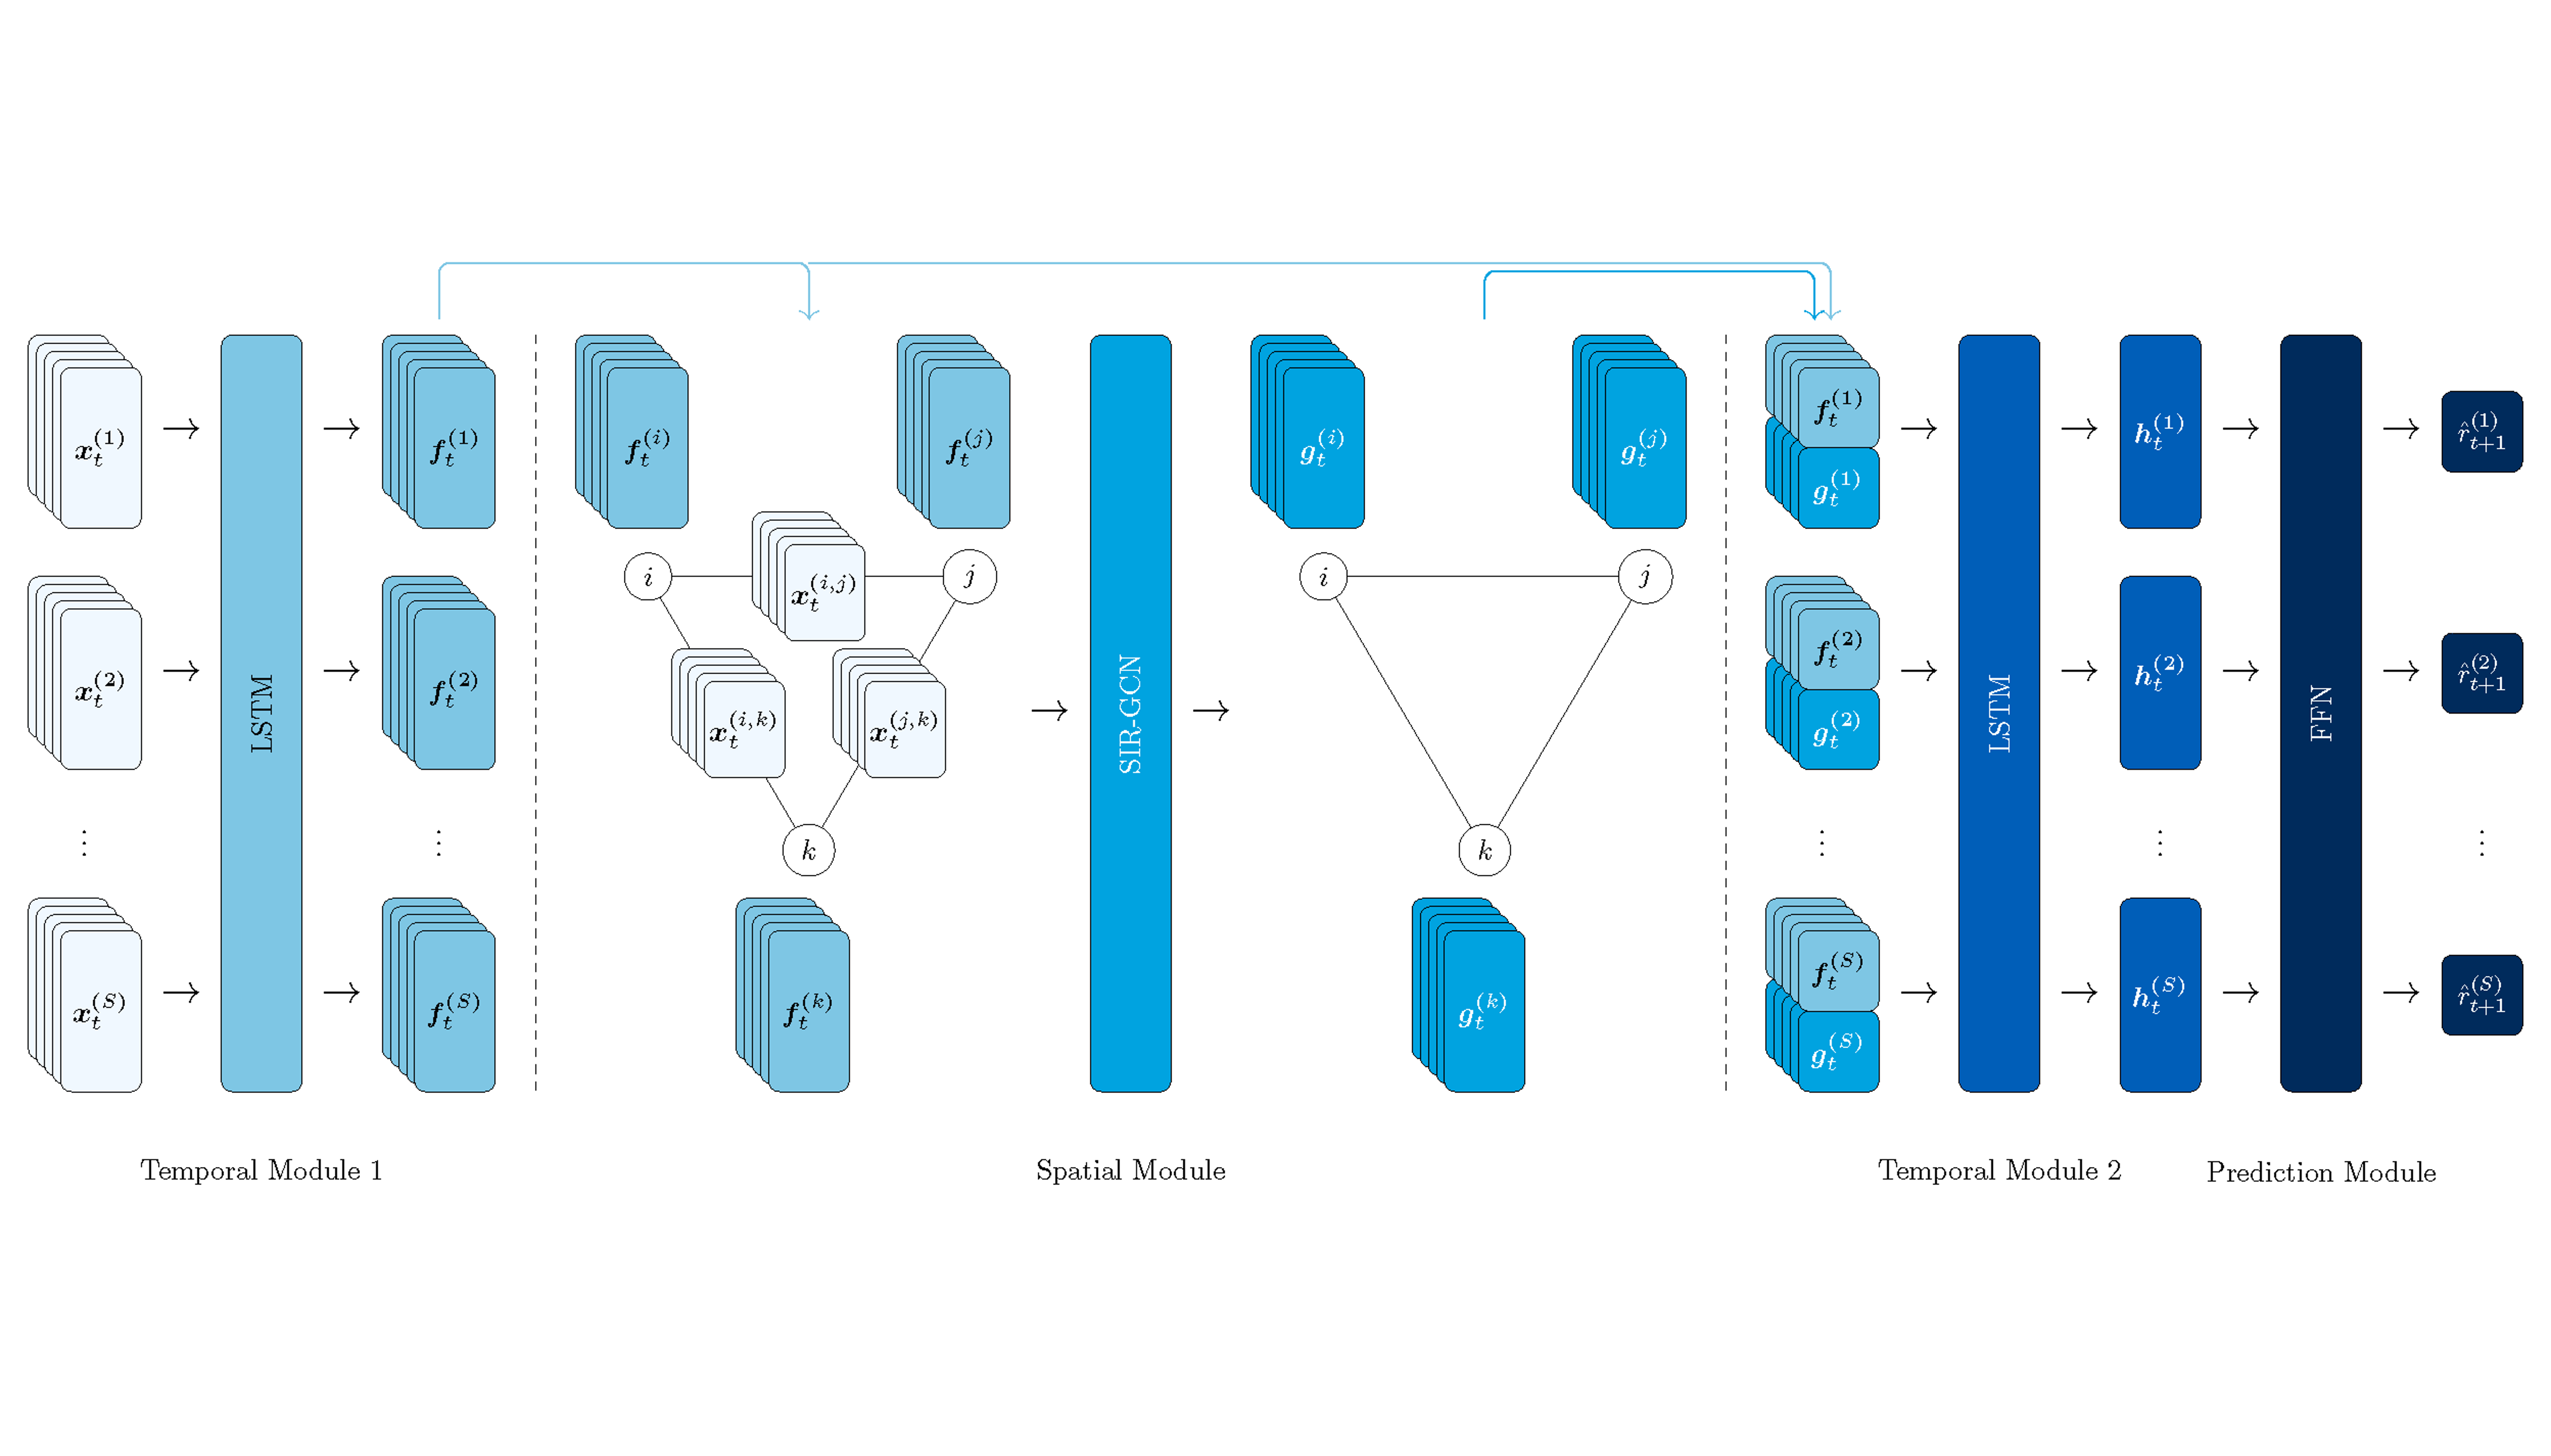
Our proposed Financial SIR-GCN (FinSIR) integrates SIR-GCN with the “sandwich” structure employed in GNN for time series analysis (GNN4TS) to jointly process the two key dimensions of stock market graphs and obtain spatio-temporally contextualized hidden states. It consists of four key modules described below.
Financial SIR-GCN (FinSIR) Architecture.
Temporal Module 1
For every stock , the temporal module 1 independently processes the sequential features to extract the sequential hidden states .
Spatial Module
The spatial module then performs message-passing for every time based on a modified SIR-GCN that accepts edge features.
Temporal Module 2
Motivated by the “sandwich” structure in GNN4TS, FinSIR introduces a second LSTM temporal module. With the two LSTM temporal modules, FinSIR can jointly and effectively process the spatial and temporal dimensions of stock market graphs.
Prediction Module
Finally, the prediction module predicts the return of every stock on the following trading day based on historical data from the past trading days.
Loss Function
FinSIR is then trained using a loss function that combines both point-wise regression loss and pair-wise ranking-aware loss, defined as
Backtesting Results on NYSE and NASDAQ
To evaluate the performance of FinSIR, we considered the NYSE and NASDAQ. The code to reproduce the results is available at the FinSIR repository.
Dataset
The data was obtained from the Temporal Relational Ranking for Stock Prediction repository. A summary of the market data considered is presented below.
| Market | Stocks | Train Days Jan 2, 2013 - Dec 31, 2015 | Validation Days Jan 4, 2016 - Dec 30, 2016 | Test Days Jan 3, 2017 - Dec 8, 2017 |
|---|---|---|---|---|
| NYSE | 1,737 | 756 | 252 | 237 |
| NASDAQ | 1,026 | 756 | 252 | 237 |
Summary of Market Data.
Node Features
The node features consist of the closing price as well as the 5, 10, 20, and 30 moving average closing prices. These features are then normalized by their average over the past trading days.
Edge Features
The edge features are static multi-hot binary encodings that indicate the presence or absence of predefined relations between the two stocks. Moreover, two stocks are connected by an edge if and only if at least one of the relations is present. Two types of relational graphs are considered.
Wiki Graph
The Wiki graph describes the first-order and second-order company relations based on information from Wikidata. In particular,
- stocks and share a first-order relation if there exists a statement that has stock as the subject and stock as the object; and
- stocks and share a second-order relation if there exist statements with stocks and as the subjects sharing a common object.
Industry Graph
The industry graph describes stocks belonging to the same industry based on the official classifications of NYSE and NASDAQ.
Backtesting Strategy
To evaluate the performance of FinSIR, the daily buy-hold-sell trading strategy was considered, where
- the top stocks based on the predicted one-day return are bought when the market closes on every trading day ; and
- these stocks are sold when the market closes at the next trading day .
Moreover, the following assumptions were also made:
- The total amount invested on every trading day is constant;
- The market is liquid such that buy and sell orders always get filled at the closing price of every trading day; and
- The transaction costs are negligible.
NYSE Results
The cumulative investment return ratio (IRR), mean reciprocal rank (MRR), and mean squared error (MSE) for the baseline models, FinSIR, and SimpleFinSIR (an ablation model of FinSIR) on NYSE are presented below.
| Model | IRR1 (↑) | IRR5 (↑) | MRR1 (↑) | MRR5 (↑) | MSE (↓) |
|---|---|---|---|---|---|
| RankLSTM | 0.0140 | 0.0605 | 0.0260 | 0.0168 | 2.27 × 10⁻⁴ |
| RSR-I (Wiki) | 0.6148 | 0.4465 | 0.0265 | 0.0234 | 2.27 × 10⁻⁴ |
| RSR-E (Wiki) | 0.9491 | 0.4075 | 0.0339 | 0.0226 | 2.28 × 10⁻⁴ |
| STGCN (Wiki) | 0.0959 | 0.1558 | 0.0149 | 0.0134 | 2.96 × 10⁻⁴ |
| DCGRU (Wiki) | -0.8051 | -0.1325 | 0.0265 | 0.0231 | 2.29 × 10⁻⁴ |
| SimpleFinSIR (Wiki) | 1.3457 | 0.5673 | 0.0369 | 0.0244 | 2.28 × 10⁻⁴ |
| FinSIR (Wiki) | 1.6034 | 0.4337 | 0.0298 | 0.0200 | 2.27 × 10⁻⁴ |
| RSR-I (industry) | 1.1937 | 0.4734 | 0.0348 | 0.0229 | 2.27 × 10⁻⁴ |
| RSR-E (industry) | 1.2093 | 0.4335 | 0.0362 | 0.0235 | 2.27 × 10⁻⁴ |
| STGCN (industry) | 0.4507 | -0.0605 | 0.0390 | 0.0260 | 3.64 × 10⁻⁴ |
| DCGRU (industry) | 0.3553 | 0.0571 | 0.0310 | 0.0221 | 2.28 × 10⁻⁴ |
| SimpleFinSIR (industry) | 1.2739 | 0.4796 | 0.0343 | 0.0221 | 2.28 × 10⁻⁴ |
| FinSIR (industry) | 1.4761 | 0.5338 | 0.0353 | 0.0246 | 2.28 × 10⁻⁴ |
■: best model; ■: second best model; ■: third best model; bold: statistically significant vs. best baseline model with same relational graph.
Summary of Performance Metrics for Baseline and Proposed Models on NYSE.
The cumulative IRR for the baseline and proposed models across the backtesting period is also presented below.
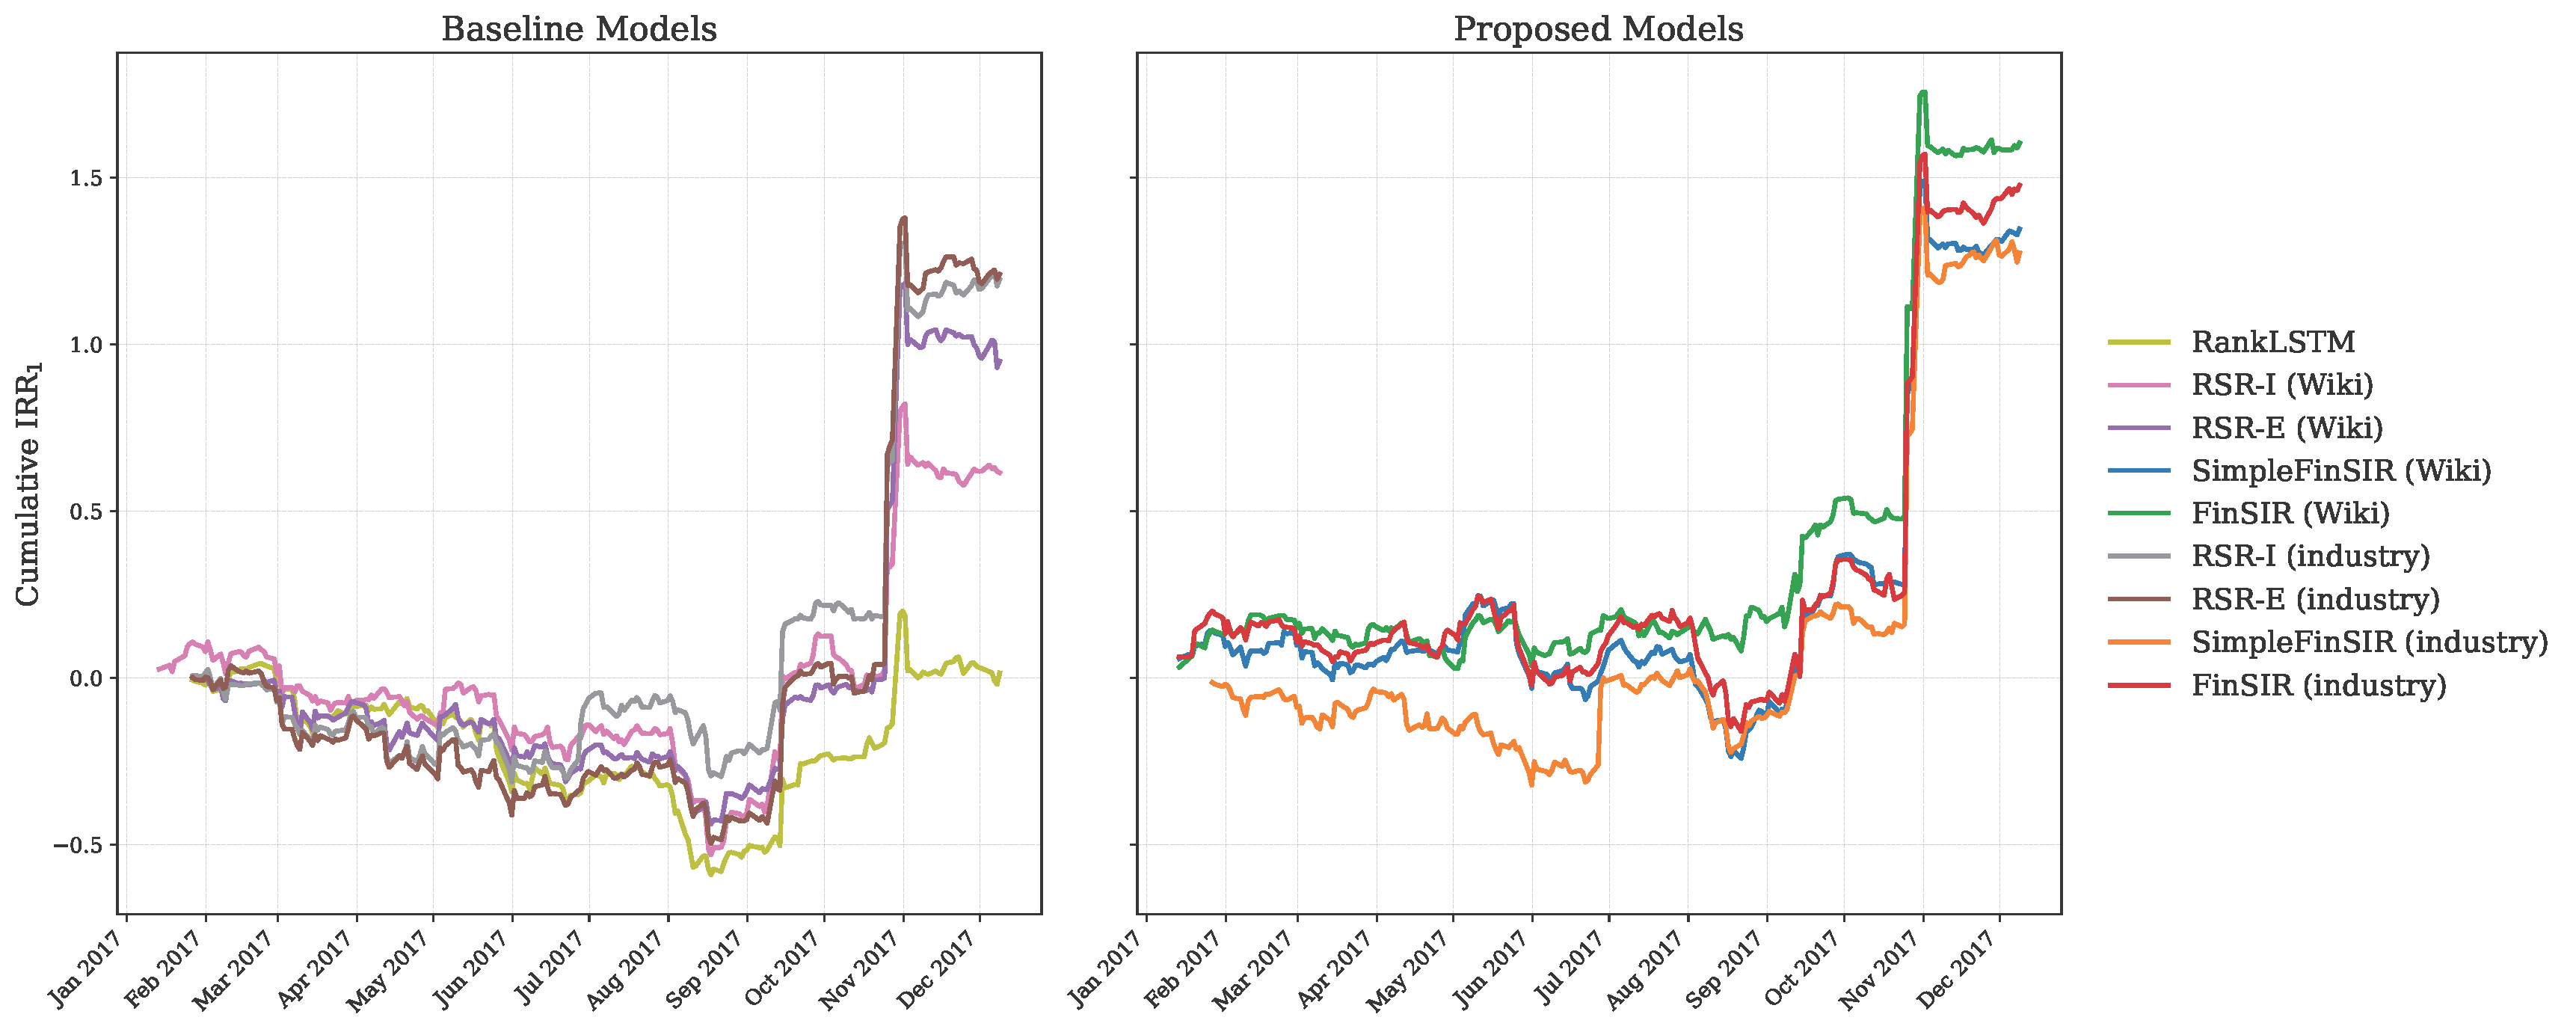
Cumulative IRR for Baseline and Proposed Models on NYSE.
Notably, FinSIR and SimpleFinSIR consistently outperform the baseline models—RankLSTM, RSR-I, RSR-E, STGCN, and DCGRU—in terms of IRR, which is the primary objective of stock recommendation. This highlights the significance of the “sandwich” structure and the second LSTM temporal module in jointly processing the spatial and temporal dimensions of the stock market graphs.
While performance in terms of MRR and MSE suggests that both FinSIR and SimpleFinSIR perform comparably with the baseline models, this does not necessarily translate to better IRR performance as illustrated by Feng et al. In particular, a model may exhibit worse MSE performance yet still achieve better IRR performance due to its ability to correctly rank the stocks. Conversely, a model may also exhibit better MSE performance yet achieve worse IRR performance if it fails to correctly rank the stocks. Thus, while nearly all models perform comparably in terms of accurately predicting future stock returns, the proposed models perform best at ranking stocks based on true future stock returns, thereby providing better investment recommendations.
NASDAQ Results
The performance metrics for the baseline and proposed models on NASDAQ are also presented below.
| Model | IRR1 (↑) | IRR5 (↑) | MRR1 (↑) | MRR5 (↑) | MSE (↓) |
|---|---|---|---|---|---|
| RankLSTM | 0.2882 | 0.1485 | 0.0340 | 0.0201 | 3.78 × 10⁻⁴ |
| RSR-I (Wiki) | 0.2476 | 0.0630 | 0.0308 | 0.0175 | 3.79 × 10⁻⁴ |
| RSR-E (Wiki) | 0.2085 | 0.2044 | 0.0299 | 0.0188 | 3.79 × 10⁻⁴ |
| STGCN (Wiki) | 0.4171 | 0.3222 | 0.0298 | 0.0242 | 4.27 × 10⁻⁴ |
| DCGRU (Wiki) | 0.0342 | 0.3039 | 0.0295 | 0.0217 | 3.79 × 10⁻⁴ |
| SimpleFinSIR (Wiki) | 1.1161 | 0.4460 | 0.0472 | 0.0262 | 3.77 × 10⁻⁴ |
| FinSIR (Wiki) | 0.7838 | 0.3051 | 0.0408 | 0.0241 | 3.95 × 10⁻⁴ |
| RSR-I (industry) | 0.5934 | 0.2983 | 0.0309 | 0.0220 | 3.80 × 10⁻⁴ |
| RSR-E (industry) | 1.1114 | 0.5670 | 0.0462 | 0.0273 | 3.78 × 10⁻⁴ |
| STGCN (industry) | 0.8669 | 0.1850 | 0.0409 | 0.0272 | 9.66 × 10⁻⁴ |
| DCGRU (industry) | 0.6423 | 0.3493 | 0.0392 | 0.0247 | 3.81 × 10⁻⁴ |
| SimpleFinSIR (industry) | 0.9334 | 0.3106 | 0.0429 | 0.0242 | 3.77 × 10⁻⁴ |
| FinSIR (industry) | 1.2307 | 0.6747 | 0.0487 | 0.0310 | 3.78 × 10⁻⁴ |
■: best model; ■: second best model; ■: third best model; bold: statistically significant vs. best baseline model with same relational graph.
Summary of Performance Metrics for Baseline and Proposed Models on NASDAQ.
The cumulative IRR for the baseline and proposed models across the backtesting period is also presented below.
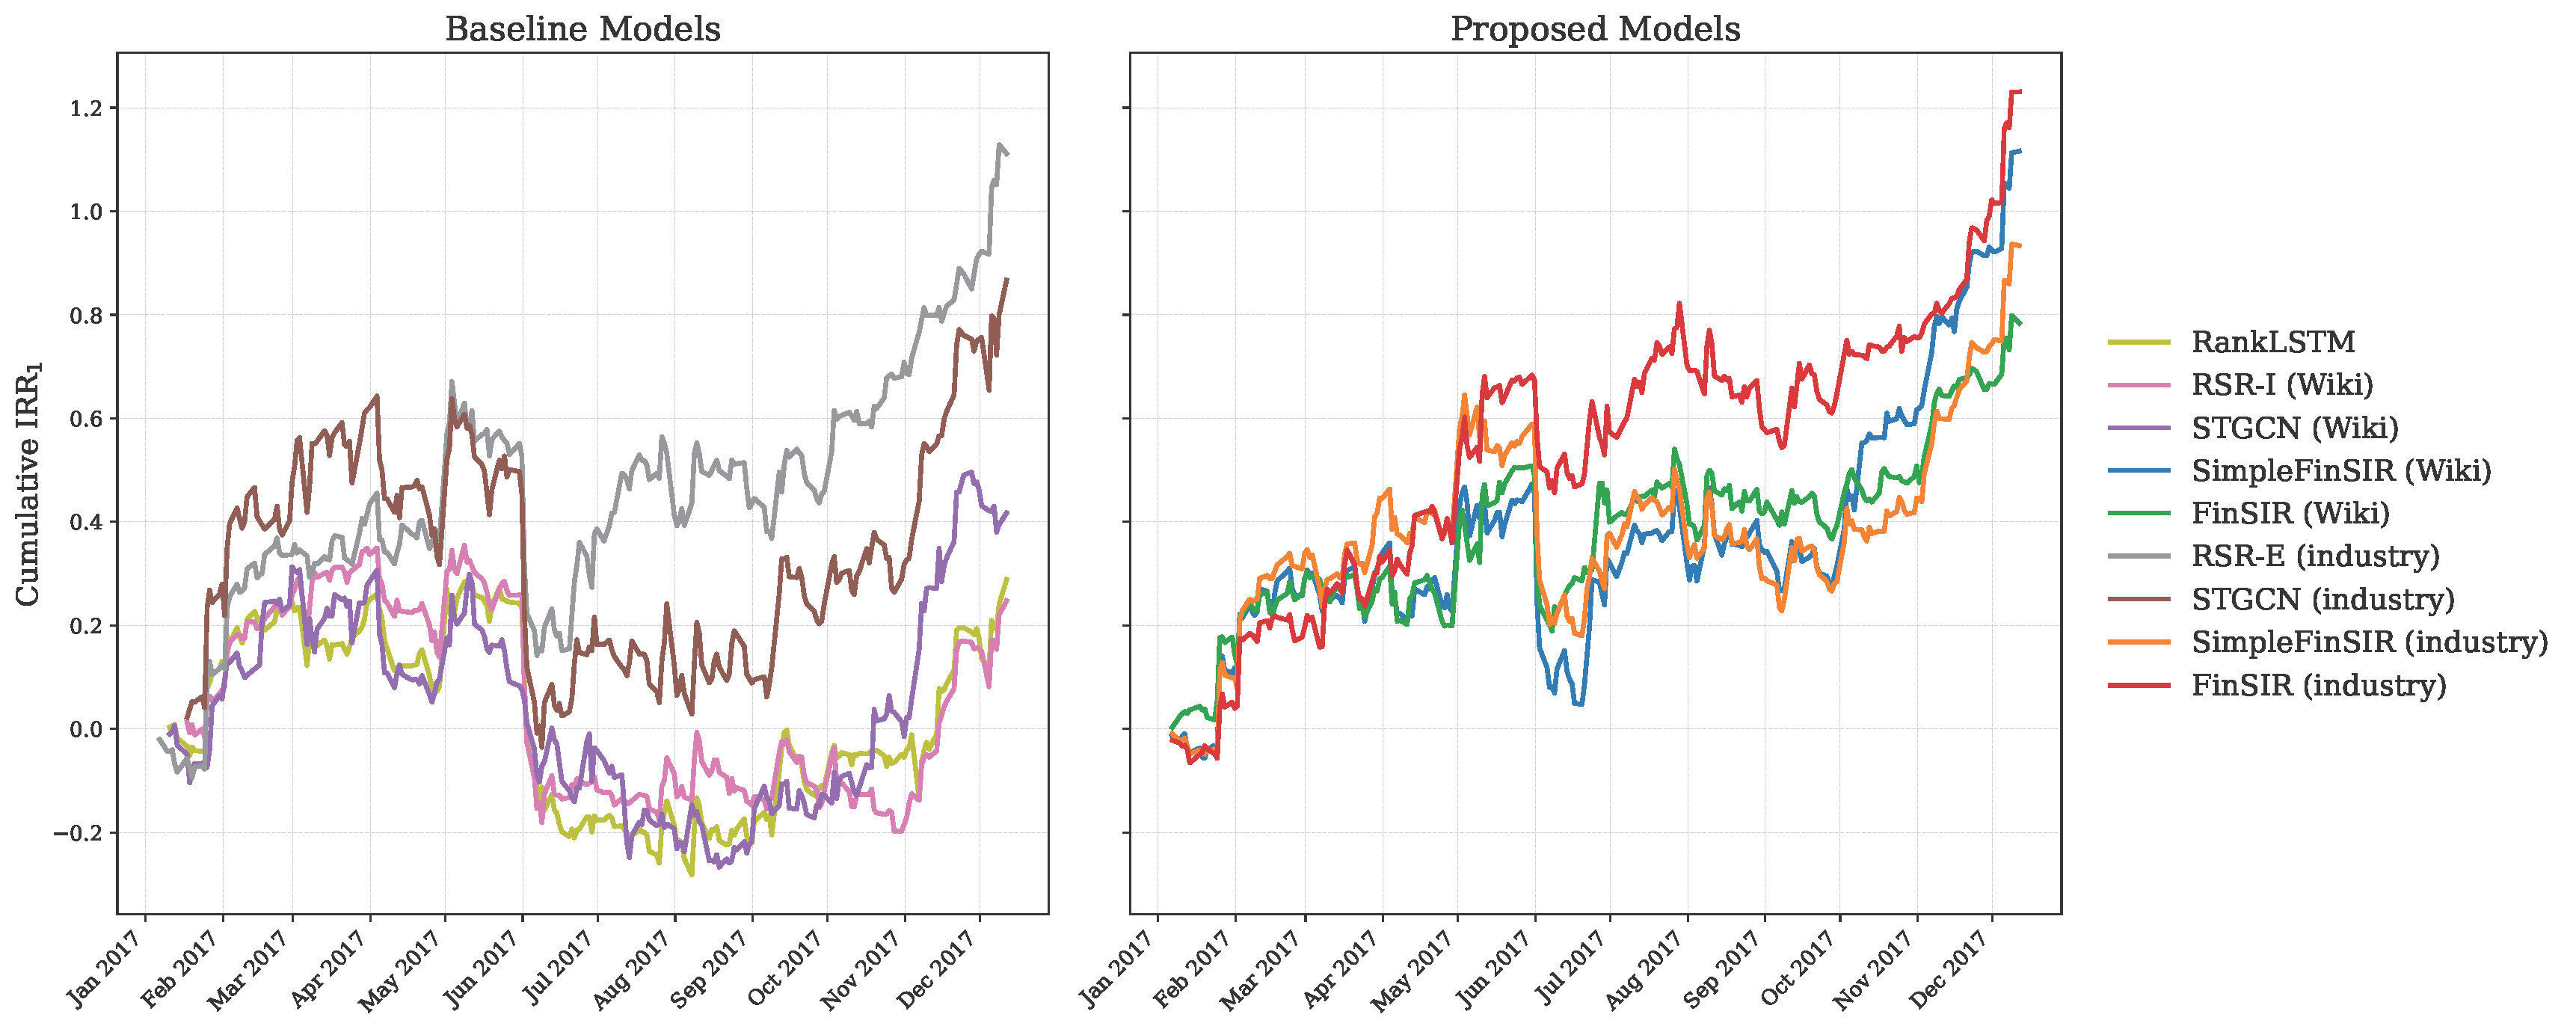
Cumulative IRR for Baseline and Proposed Models on NASDAQ.
Similarly, FinSIR and SimpleFinSIR outperform the baseline models in terms of IRR. This highlights the role of SIR-GCN in capturing the complex and non-linear stock relations in the market.
Conclusion
Overall, building upon our previous work on SIR-GCN, we developed FinSIR for market-aware stock recommendation. It integrates SIR-GCN with the “sandwich” structure in GNN4TS to jointly process the two key dimensions of stock market graphs and obtain spatio-temporally contextualized representations. This work perfectly lies at the intersection of my two research interests—finance and graph theory—and serves as a great way to expand my professional and academic network with distinguished experts in the fields.
Let me know your thoughts!